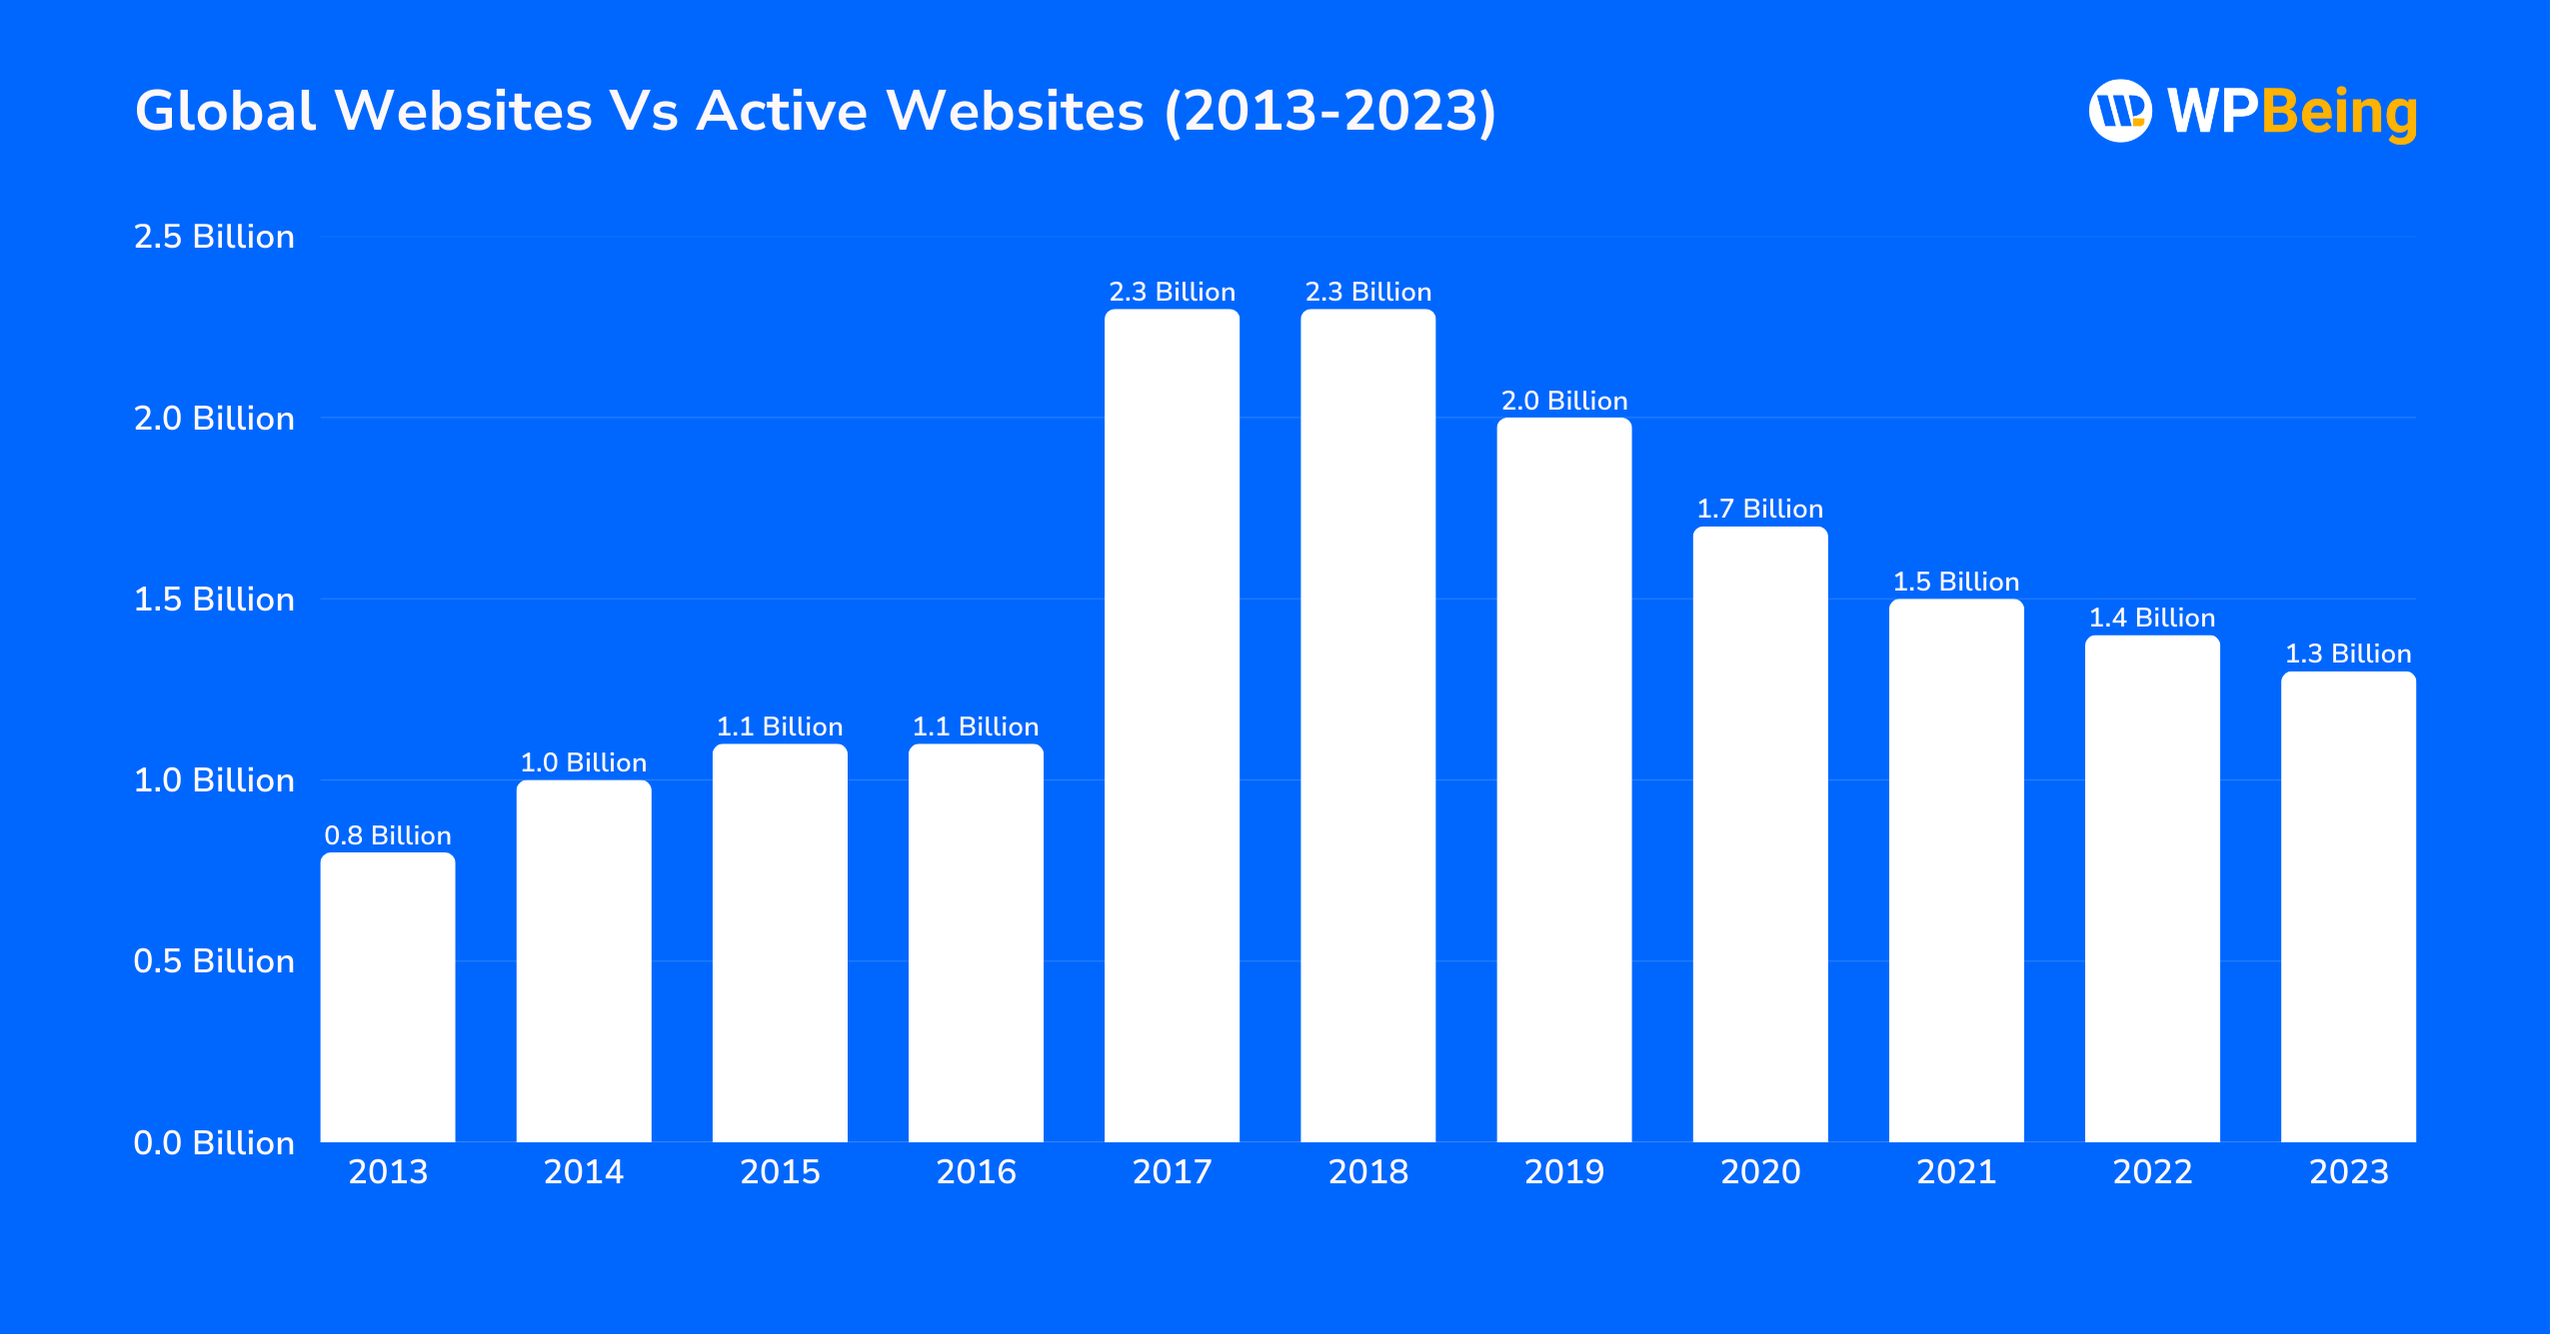
While the total number of websites once peaked at 2.3 billion in 2017, that figure has since dropped to 1.3 billion as of 2023. However, what’s even more surprising is that only 15% of these websites are actually active, meaning the majority are either abandoned, expired, or inactive.
From personal blogs to global e-commerce giants, websites continue to shape our online experience. But with new sites being created daily and others disappearing, tracking the exact number is a challenge.
In this article, I will explore the current state of the web, how websites have evolved, and the fascinating trends shaping the future of the internet. Let us get started.
Top Picks: How Many Websites Exist?
- As of 2024, the total number of websites globally has surpassed 1.88 billion.
- Google.com is the most visited website in the world, with a staggering 136 billion monthly visits. (Statista)
- The total number of websites peaked at 2.3 billion in 2017 but declined to 1.3 billion by 2023. Only 15% of websites were active in 2023, compared to 24% in 2013. (Reboot Online)
- .com dominates with 38.36% of all domains.
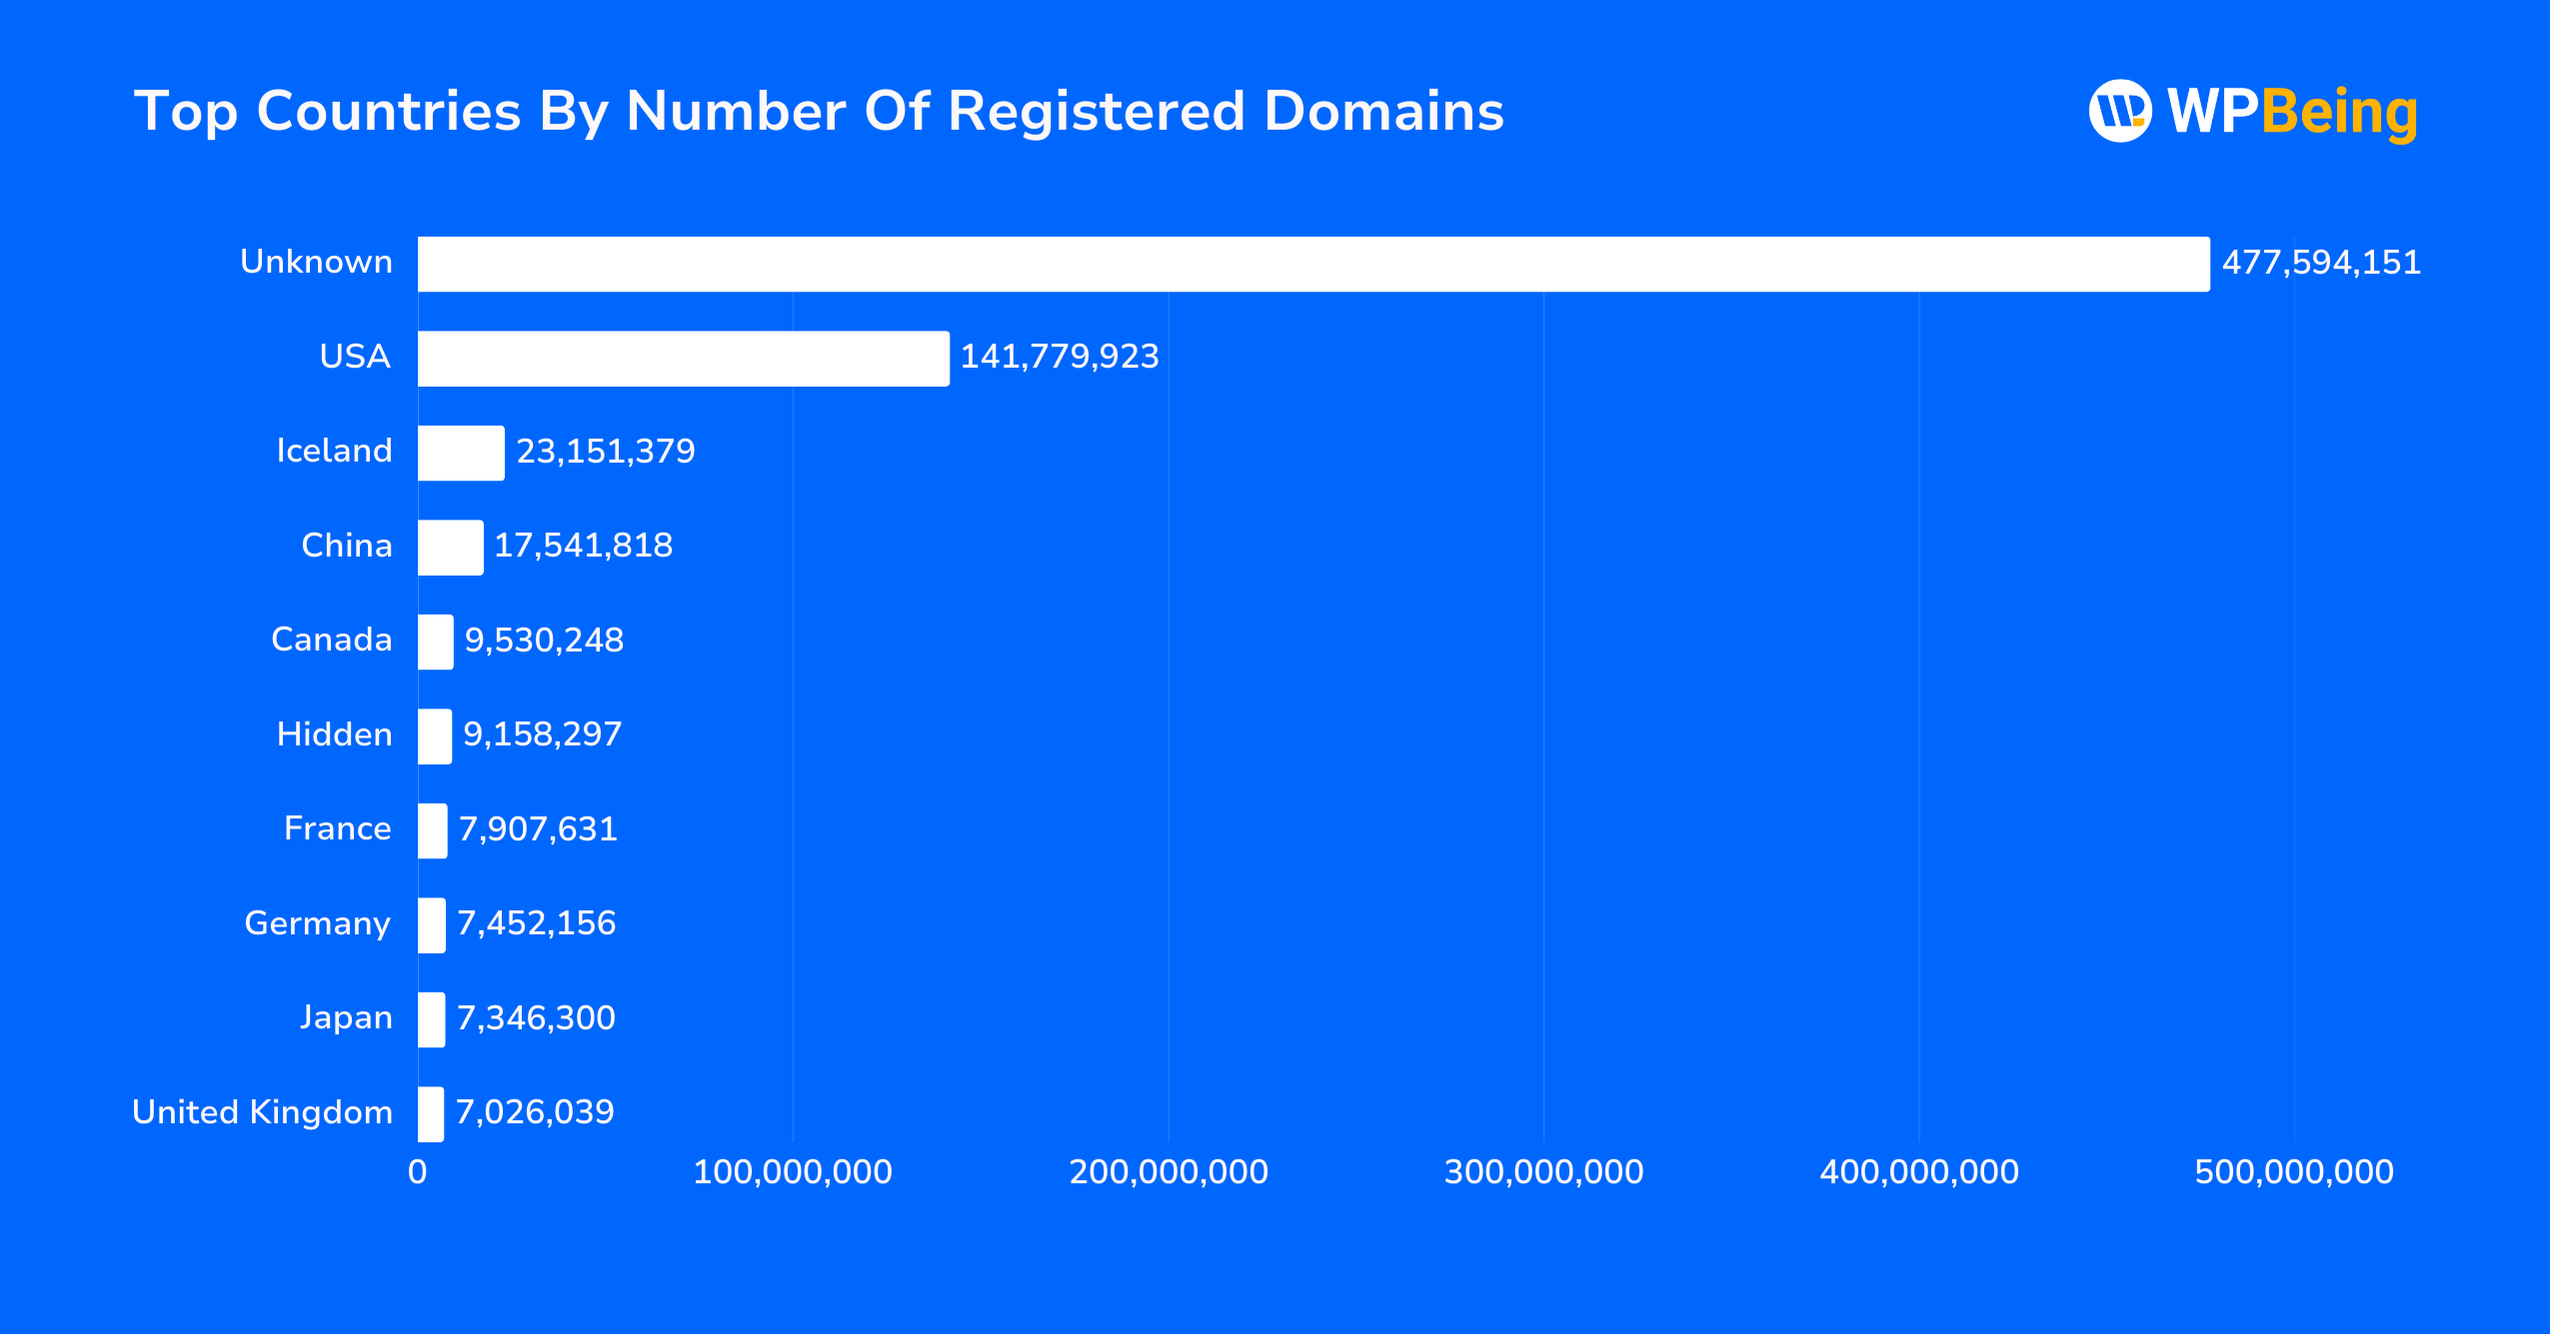
- 62.53% of registered domains have an “Unknown” classification, making ownership tracking difficult. The U.S. ranks second with 18.56% (141.8 million domains). (Domainnamestat)
- Google indexes 40 to 70 billion pages as of 2024. (Worldwebsize)
- 62.54% of global web traffic comes from mobile devices. (Statista)
- The most used language for websites is English, which dominates (49.4%), followed by Spanish (6%) and German (5.6%). (Statista)
Country Wise Breakdown Of How Many Websites Are There In World
- As of 2024, 62.53% of registered domains are classified under “Unknown,” highlighting the challenges in tracking and attributing domain ownership globally.
- United States ranks second, accounting for 18.56% of registered domains (141.8 million).

To understand the global numbers, here are the top 10 Countries by number of registered domains
| Rank | Country | Registered Domains | Share (%) |
|---|---|---|---|
| 1 | Unknown | 477,594,151 | 62.53% |
| 2 | United States of America | 141,779,923 | 18.56% |
| 3 | Iceland | 23,151,379 | 3.03% |
| 4 | China | 17,541,818 | 2.30% |
| 5 | Canada | 9,530,248 | 1.25% |
| 6 | Hidden | 9,158,297 | 1.20% |
| 7 | France | 7,907,631 | 1.04% |
| 8 | Germany | 7,452,156 | 0.98% |
| 9 | Japan | 7,346,300 | 0.96% |
| 10 | United Kingdom | 7,026,039 | 0.92% |
How Many Web Pages Are There? Year Wise Breakdown
- The total global websites peaked at 2.3 billion in 2017 but declined to 1.3 billion by 2023. In 2023, only ~15% of all websites were active, compared to nearly 24% in 2013.

Let us look at the breakdown of global websites vs. active websites (2013-2023):
| Year | Active Websites (Millions) | Total Global Websites (Billions) | Active Websites (%) |
|---|---|---|---|
| 2013 | 190 | 0.8 | 23.75% |
| 2014 | 185 | 1.0 | 18.5% |
| 2015 | 180 | 1.1 | 16.4% |
| 2016 | 175 | 1.1 | 15.9% |
| 2017 | 175 | 2.3 | 7.6% |
| 2018 | 175 | 2.3 | 7.6% |
| 2019 | 180 | 2.0 | 9% |
| 2020 | 190 | 1.7 | 11.2% |
| 2021 | 200 | 1.5 | 13.3% |
| 2022 | 195 | 1.4 | 13.9% |
| 2023 | 190 | 1.3 | 14.6% |
- The internet started with just one website in 1991. By 1992, the number had grown 10x, reaching 10 websites. In 1993, websites increased 13-fold to 130, and by 1994, the web experienced an explosive 2,200% increase, reaching 3,000 websites.
Here is a quick table to take you through the inception of website milestones broken down year-wise:
| Year | Websites surpass FTP as the dominant internet traffic |
|---|---|
| 1991 | First website launched by Tim Berners-Lee (info.cern.ch) |
| 1993 | Mosaic browser released; web traffic surges 341,634% |
| 1994 | First banner ads; Pizza Hut starts online ordering |
| 1995 | Websites surpass FTP as dominant internet traffic |
| 1996 | Over 9,000 organizations have websites |
| 1997 | Domain business.com sells for $150,000 |
| 1998 | Google’s index reaches 26 million pages |
| 1999 | Web disrupts financial markets; e-commerce rises |
| 2000 | Web surpasses 1 billion pages; multilingual domains tested |
(Zakon)
How Many Websites Are Created Every Day?
- Approximately 175 new websites are created every minute! This means around 252,000 new websites are launched worldwide every day.
- In August 2018, approximately 380 websites were created per minute, leading to 547,200 new websites per day.
- Interestingly, the rate of new website creation has slowed over time. That means the current rate has declined by 46% over the past few years.
(Siteefy)
How Many Websites Are On Google?
- As of 2025, Google’s index includes approximately 50 to 70 billion web pages. The latest data suggests ongoing high volatility, with Google’s indexed pages still ranging between 40 billion and 70 billion.
Let us check out the breakdown:
| Time Period | Indexed Pages On Google(Billion) |
|---|---|
| 2015 – 2017 | ~35 – 45 |
| 2017 – 2019 | ~60 |
| 2020 – 2021 | ~10 |
| 2022 – Present | ~40 – 70 |
| 2023 – 2025 | ~40 – 70 |
- As of 2024, Google.com is the world’s most visited website, with a staggering 136 billion monthly visits. Since overtaking Yahoo in 2010, Google has maintained its position as the undisputed leader in online search. (Statista)
- In 2019, 66% of all web traffic referrals originated from Google, solidifying its role as the primary gateway to online content. (Spark Toro)
Websites Worldwide By Popularity
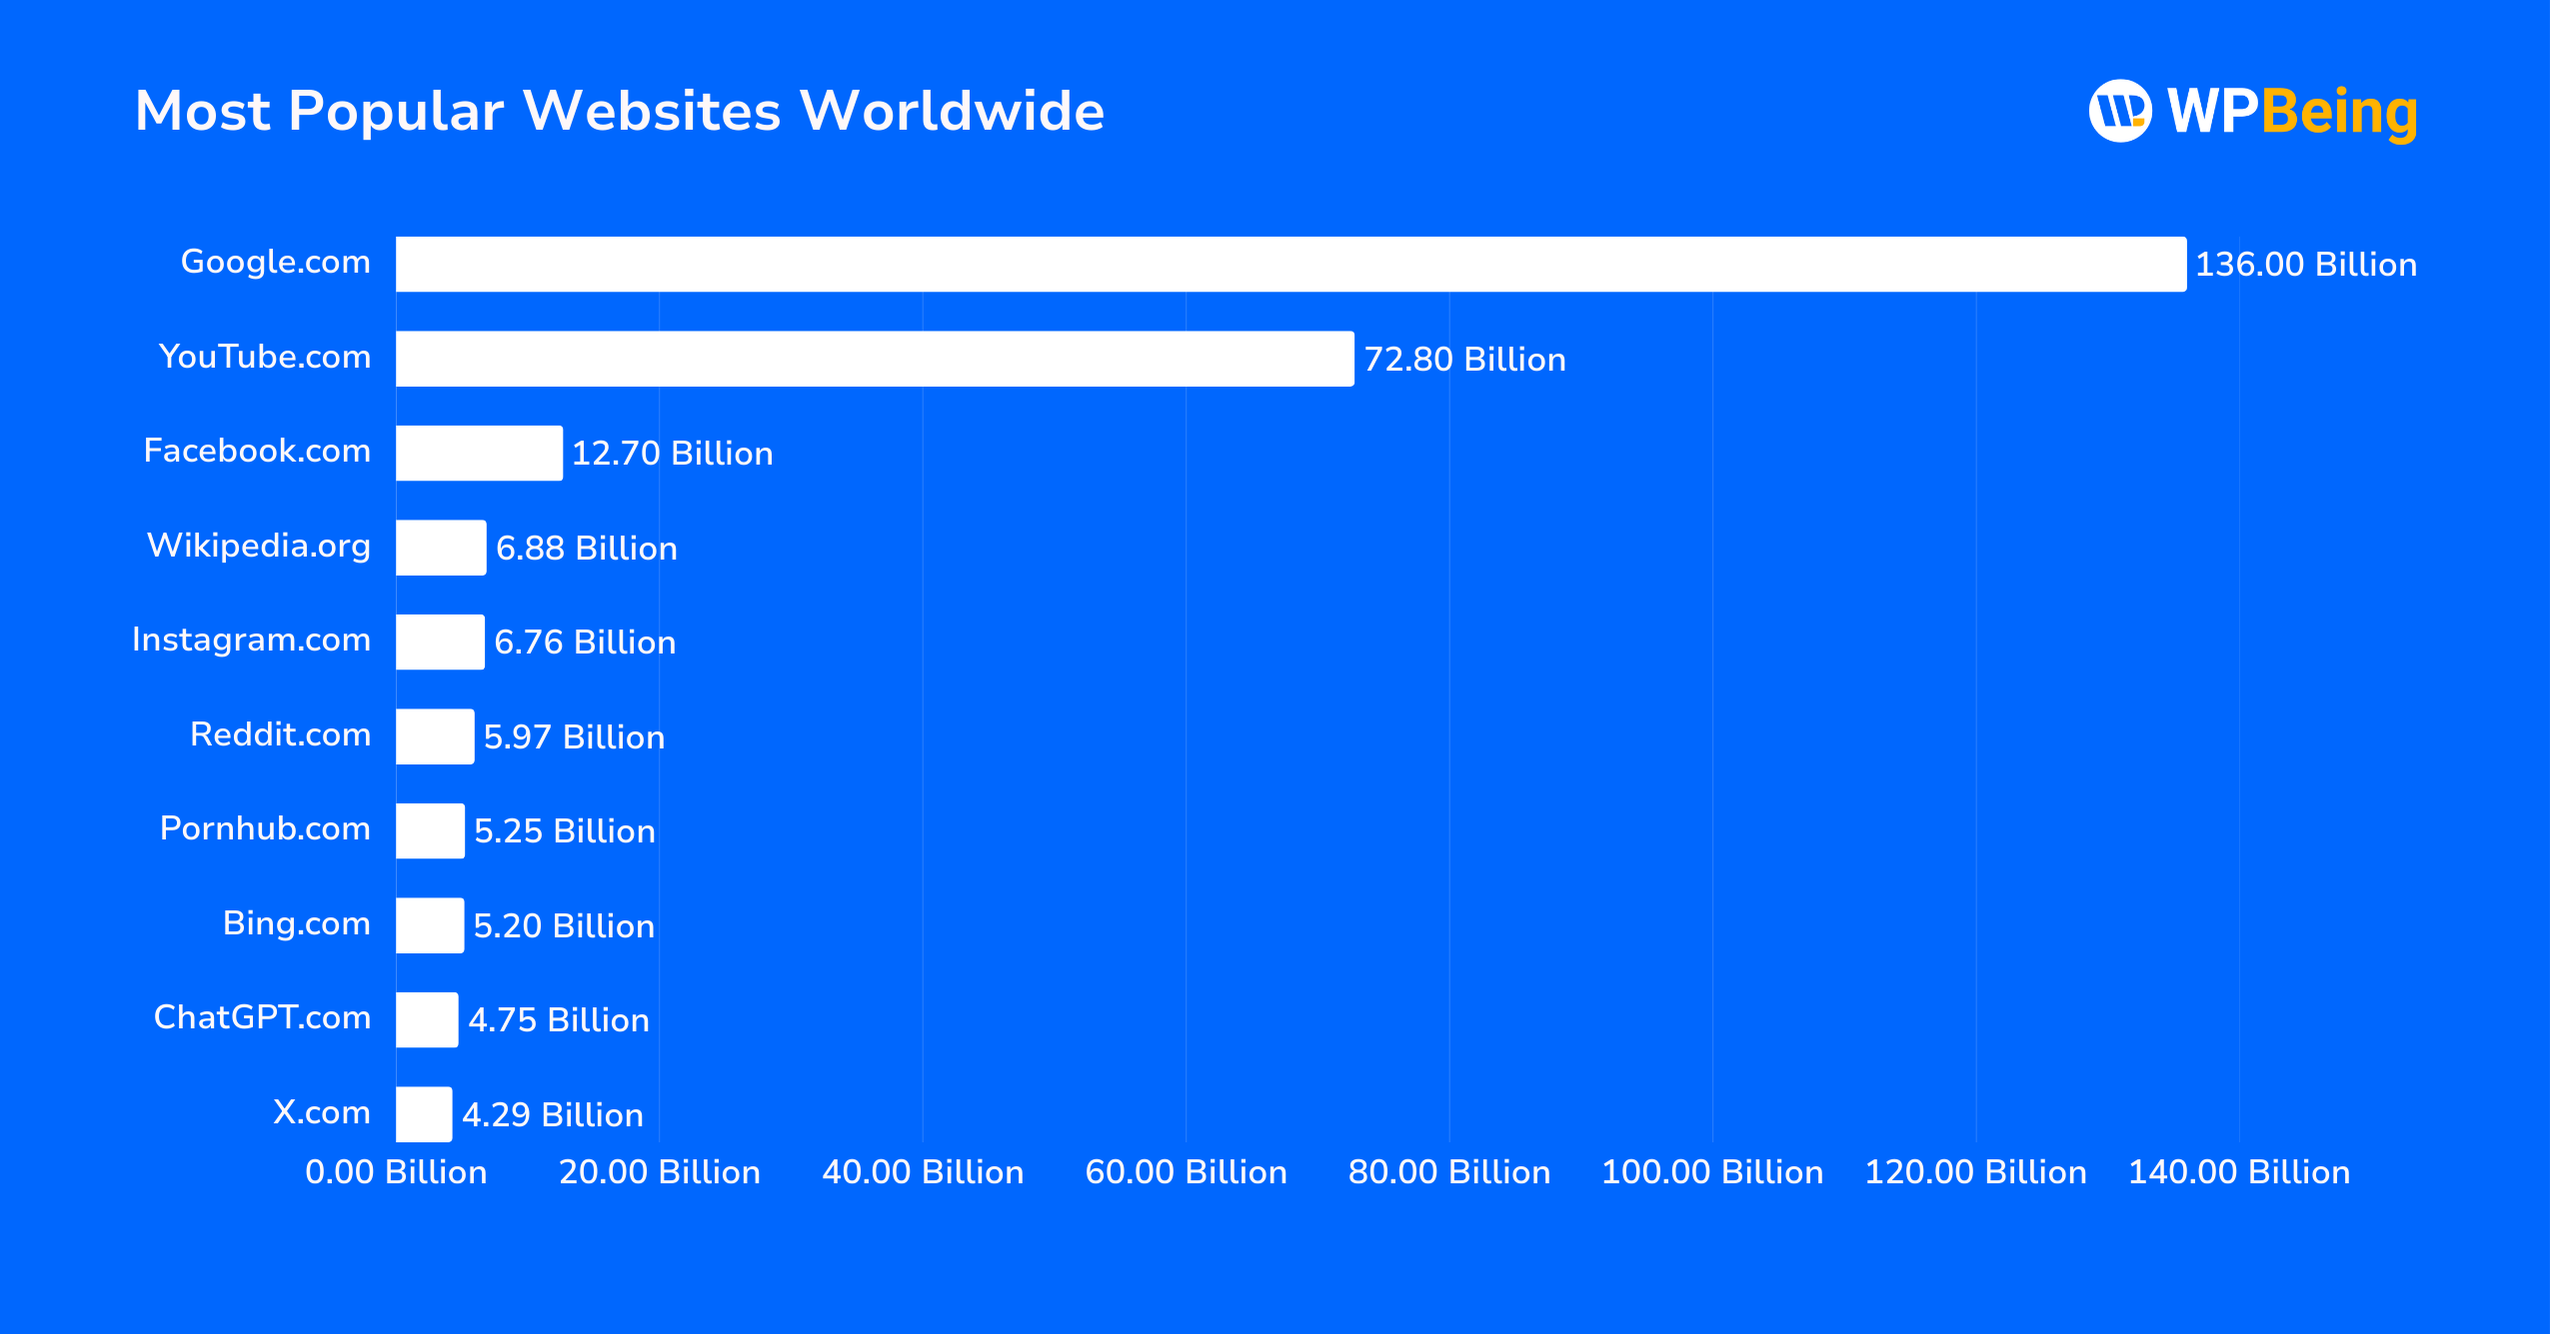
- Google.com remains the undisputed leader, with a staggering 136 billion monthly visits.
- YouTube.com ranks second with 72.8 billion visits per month as the leading platform for video content.

Let us take a look at the table of the Top 10 Most Popular Websites Worldwide as of November 2024:
| Rank | Website | Monthly Visits (in Billions) |
|---|---|---|
| 1 | Google.com | 136 |
| 2 | YouTube.com | 72.8 |
| 3 | Facebook.com | 12.7 |
| 4 | Wikipedia.org | 6.88 |
| 5 | Instagram.com | 6.76 |
| 6 | Reddit.com | 5.97 |
| 7 | Pornhub.com | 5.25 |
| 8 | Bing.com | 5.2 |
| 9 | ChatGPT.com | 4.75 |
| 10 | X.com | 4.29 |
(Statista)
How Many Mobile Websites In The World?
- Mobile devices have become the primary gateway to the web, accounting for 62.54% of global website traffic in the fourth quarter of 2024.
- In many African markets, mobile devices generate over 70% of web traffic, compared to just 45.49% in the United States, where desktop usage remains more prevalent.

Table of Mobile Device Website Traffic Share (Selected Quarters 2015–2024)
| Year | Quarter | Share of Mobile Traffic |
|---|---|---|
| 2024 | Q4 | 62.54% |
| 2024 | Q3 | 61.85% |
| 2024 | Q2 | 60.12% |
| 2024 | Q1 | 59.34% |
| 2023 | Q4 | 54.67% |
| 2023 | Q3 | 54.34% |
| 2023 | Q2 | 53.42% |
| 2023 | Q1 | 58.03% |
| 2022 | Q4 | 59.16% |
| 2022 | Q3 | 59.54% |
| 2015 | Q1 | 31.16% |
(Statista)
Business Website Statistics
- As per the latest available data collected from 2023, 71% of small businesses have their own website.
- 28% of business is now conducted online, making it imperative for businesses to have an online presence.
- 73% of businesses invest in web design, with 58% creating a new website or improving their existing one.
- Only 1.5% of SME owners claim their website is never used.
- Among SMEs using website builders, 27% prefer Squarespace, and 21% use Wix.
- 69% of SME owners without a website believe their business should have one, while only 9% disagree.
Domain Wise How Many Websites Are There Worldwide?
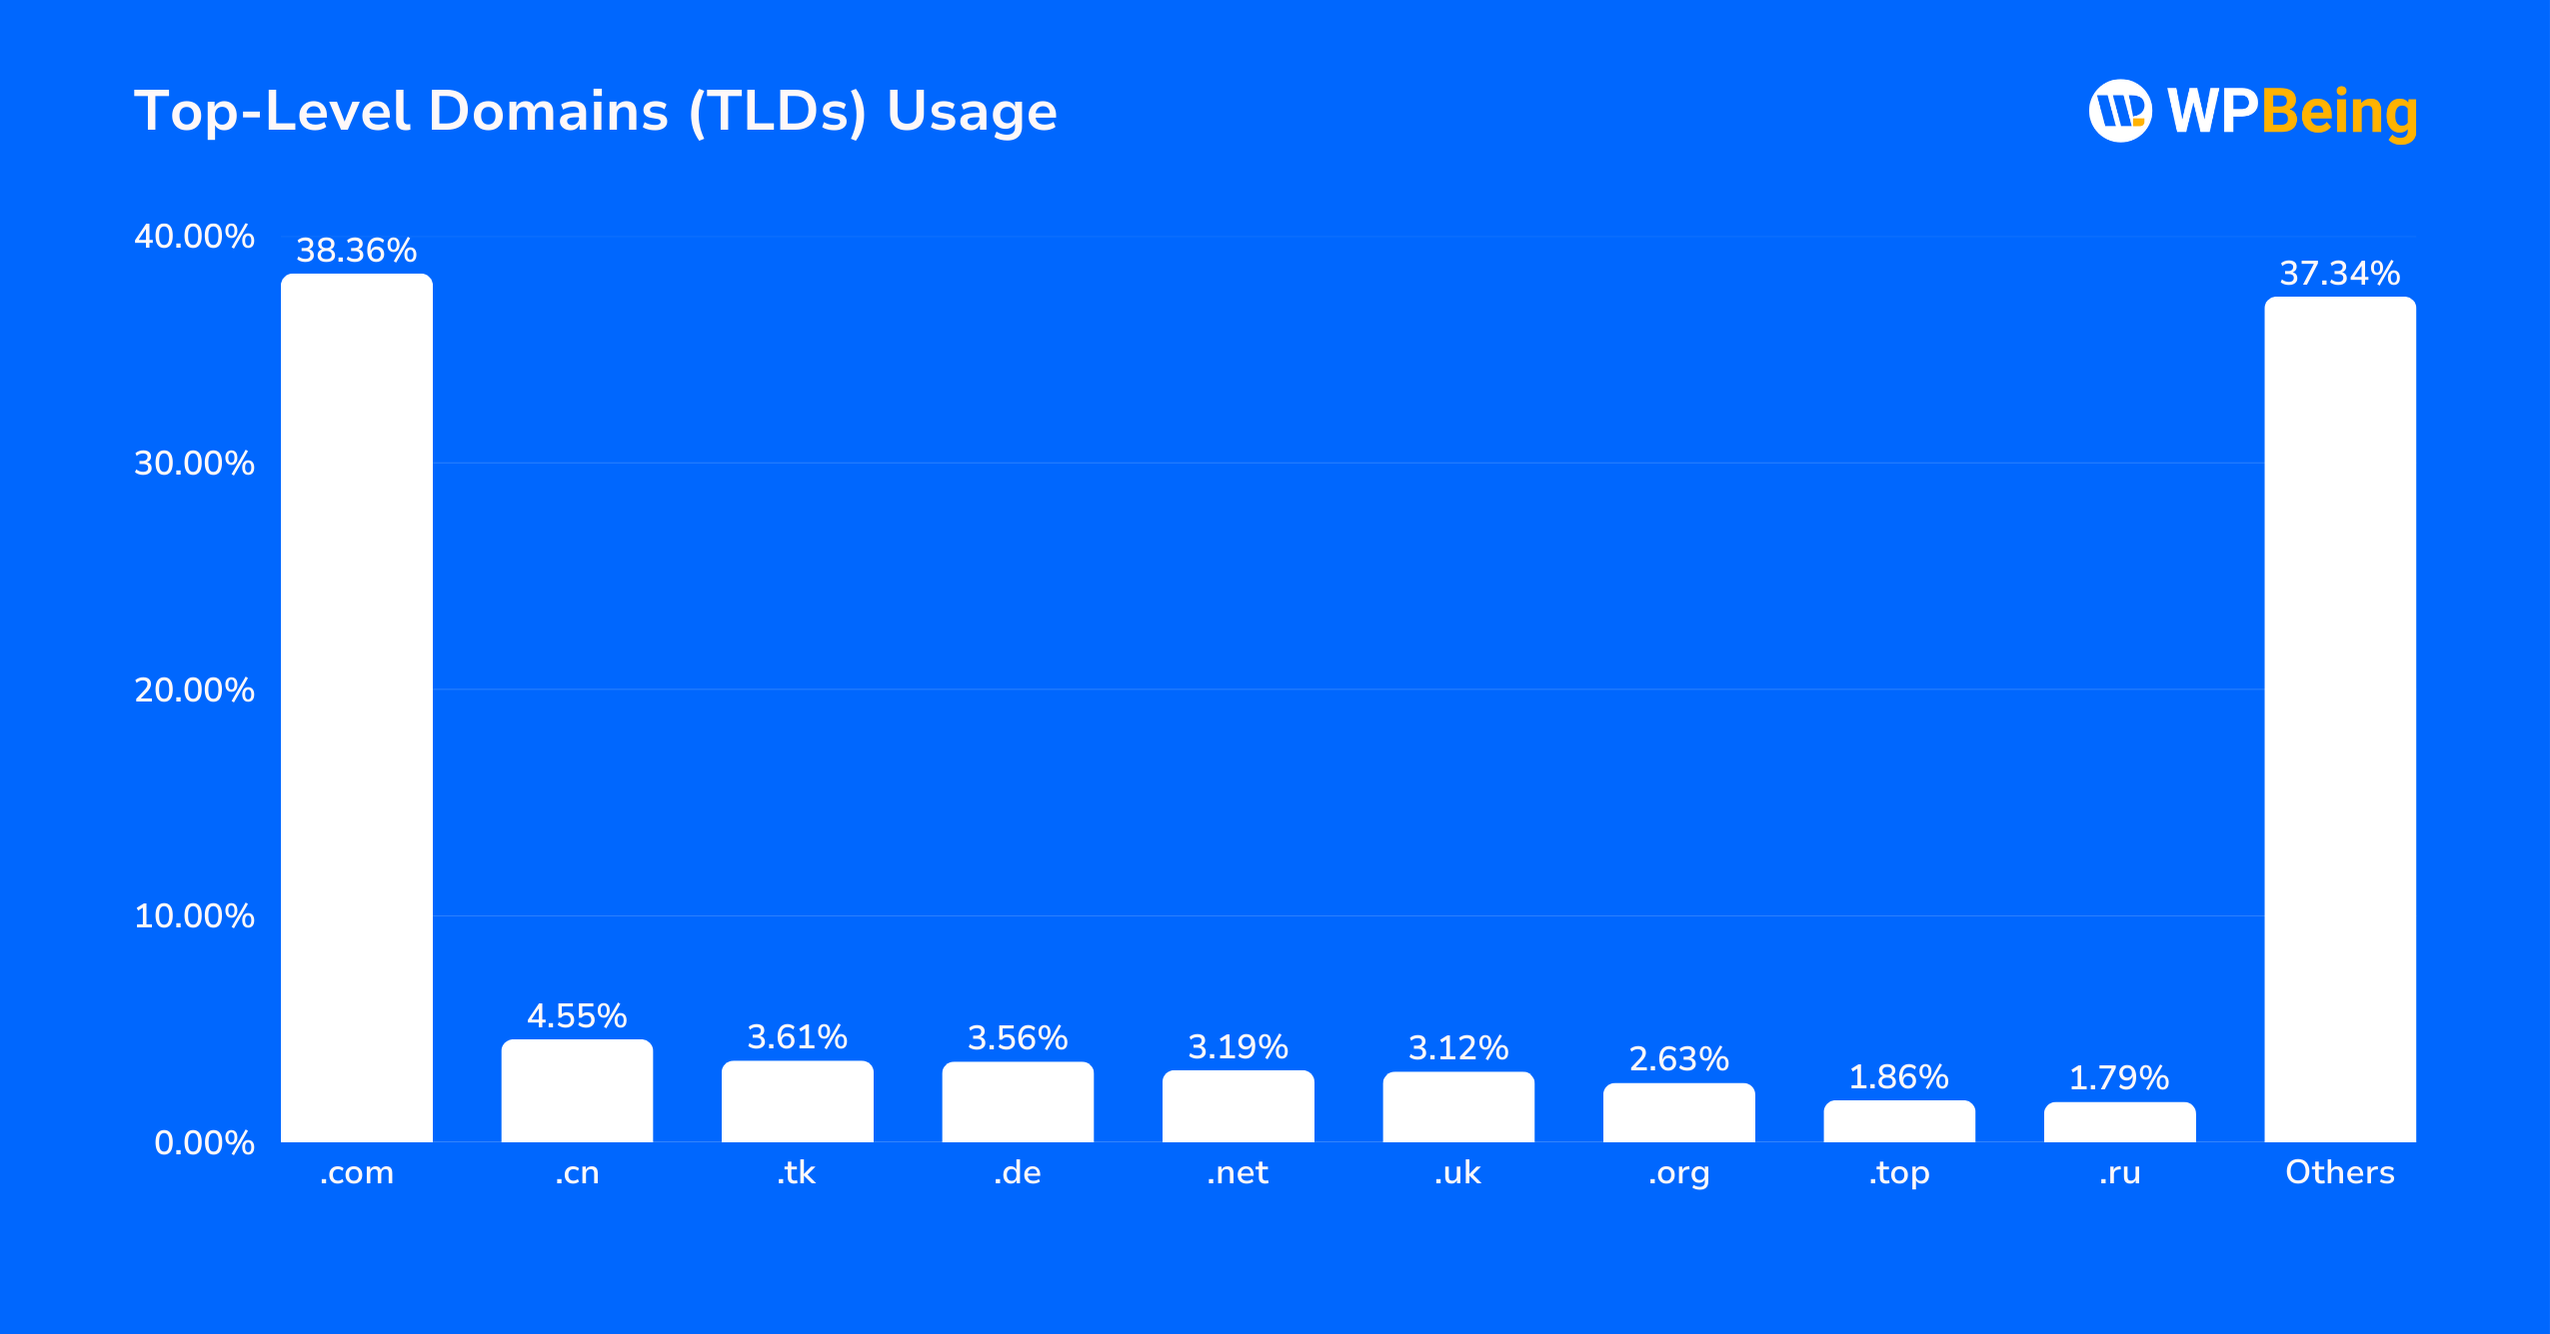
- .com is leading, accounting for 38.36% of all registered domains.

Let us look at which top-level domains (TLDs) are in use as of 2024:
| Rank | TLD | Percentage of Domains |
|---|---|---|
| 1 | .com | 38.36% |
| 2 | .cn | 4.55% |
| 3 | .tk | 3.61% |
| 4 | .de | 3.56% |
| 5 | .net | 3.19% |
| 6 | .uk | 3.12% |
| 7 | .org | 2.63% |
| 8 | .top | 1.86% |
| 9 | .ru | 1.79% |
| 10 | Others | 37.34% |
Languages Used for Websites Ranked
- English dominates the digital landscape, accounting for 49.4% of all websites as of February 2025.
- Despite the dominance of English, the internet remains a multilingual space. This is largely due to the influence of major English-speaking markets like the United States and India, which together boast over a billion internet users.
Take a look at the table of the top 10 languages used for websites (as of February 2025):
| Rank | Language | Percentage of Websites |
|---|---|---|
| 1 | English | 49.4% |
| 2 | Spanish | 6% |
| 3 | German | 5.6% |
| 4 | Japanese | 5% |
| 5 | French | 4.4% |
| 6 | Russian | 3.9% |
| 7 | Portuguese | 3.8% |
| 8 | Italian | 2.7% |
| 9 | Dutch, Flemish | 2.1% |
| 10 | Polish | 1.8% |
(Statista)


